-
Depth:
60.5 mm
-
Display Type:
Backlit LCD - 128 X 64 Pixels
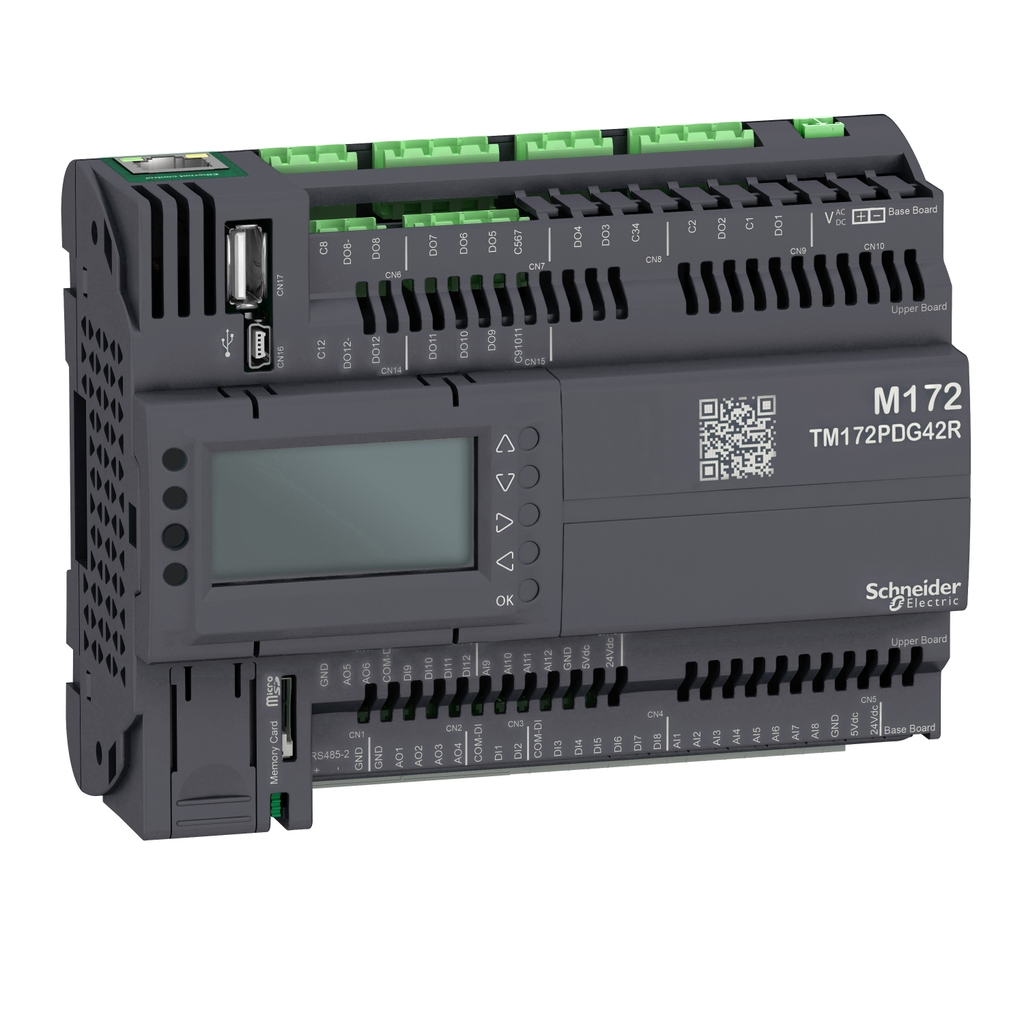
This product is part of the Modicon M171/M172 range, an offer of programmable controllers for HVAC solutions. This programmable controller offers 8 discrete inputs with sink or source (positive/negative) discrete logic. It is a module with discrete input voltage of 24V AC/DC, 2.5mA. It offers 8 configurable by pair analogue input and 2 analogue outputs of 4mA to 20mA, ±0V to ±10V. It features 3 LEDs for programmable and 1 LED for power signaling. It is an IP20 rated product. Its dimensions are 144mm (width) x 60.5mm (depth) x 110mm (height). It weighs 0.385kg. The main application of this module is HVAC and pumping solution. This product is certified by CE, EAC, CSA and CURus. It meets EN/IEC 60730 standard. It is suitable for panel mounting with accessory. Modicon M171/M172 benefits maximize profitability and energy efficiency by using scalable automation control with the Modicon M171/M172. Modicon M171/M172 logic controllers and intuitive software EcoStruxure Machine Expert - HVAC are designed for maximizing profitability and energy efficiency.