-
Country of Origin:
USA
-
Depth:
197 mm
-
Material:
Aluminum
-
Warranty Length:
18 mth
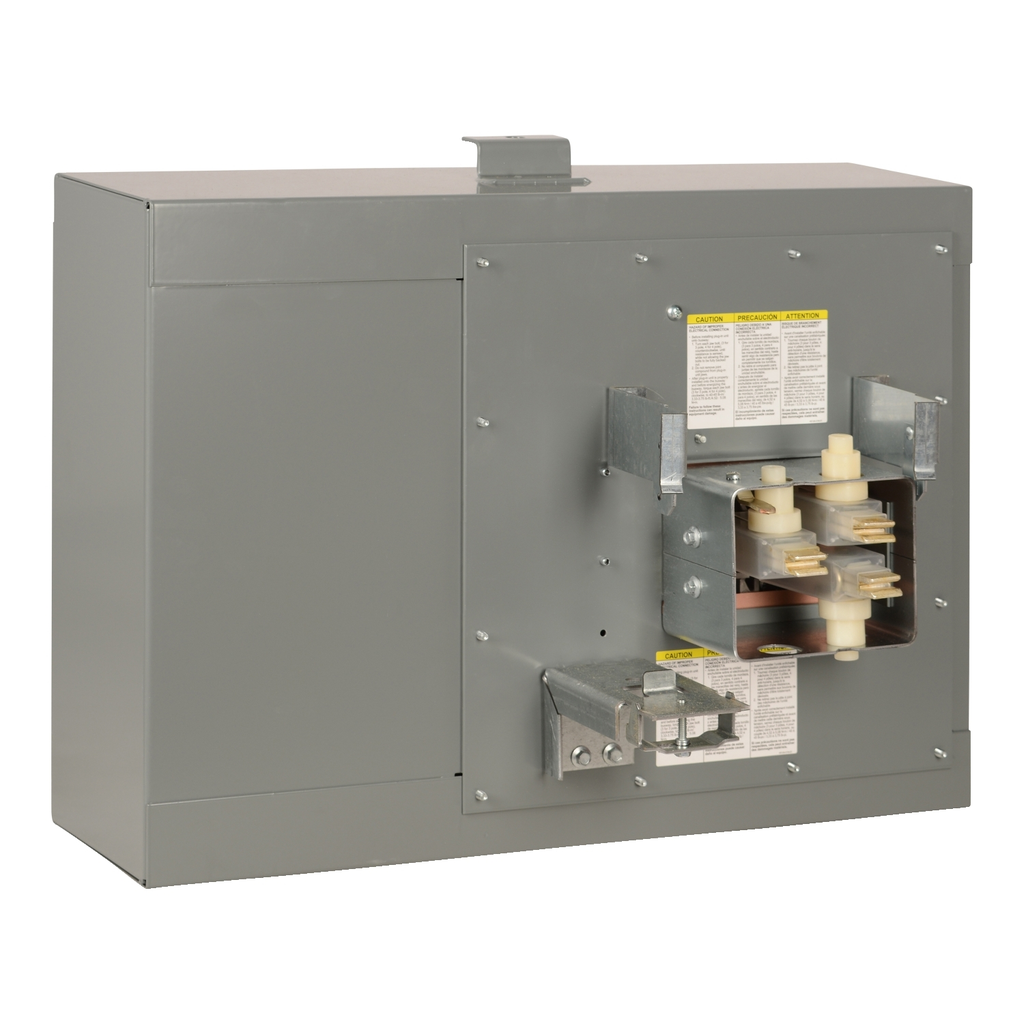
I-Line™ Busway offers a complete line of compatible, sandwich-type feeder and plug-in busway lengths, fittings, and plug-in units. I-Line plug-in busway has options up to 1600A for circuit breaker plug-ins and 1200A for fusible plug-ins. Circuit breaker and fusible plug in units are available in 3 phase, 3 wire or 3 phase, 4 wire configurations, with Aluminum or Copper conductors, for system voltages up to 600 volts. This busway system is rated to allow 100% of the current to flow continuously. This I-Line plug-in tap box is for 400A to 600A, 600VAC, 3 phase, 4 wire with integral ground bus systems. I-Line busway is UL listed and CSA certified. I-Line Busway plug-in units are UL listed and CSA certified.