-
Country of Origin:
China
-
Depth:
67 mm
-
Display Type:
Colour TFT LCD
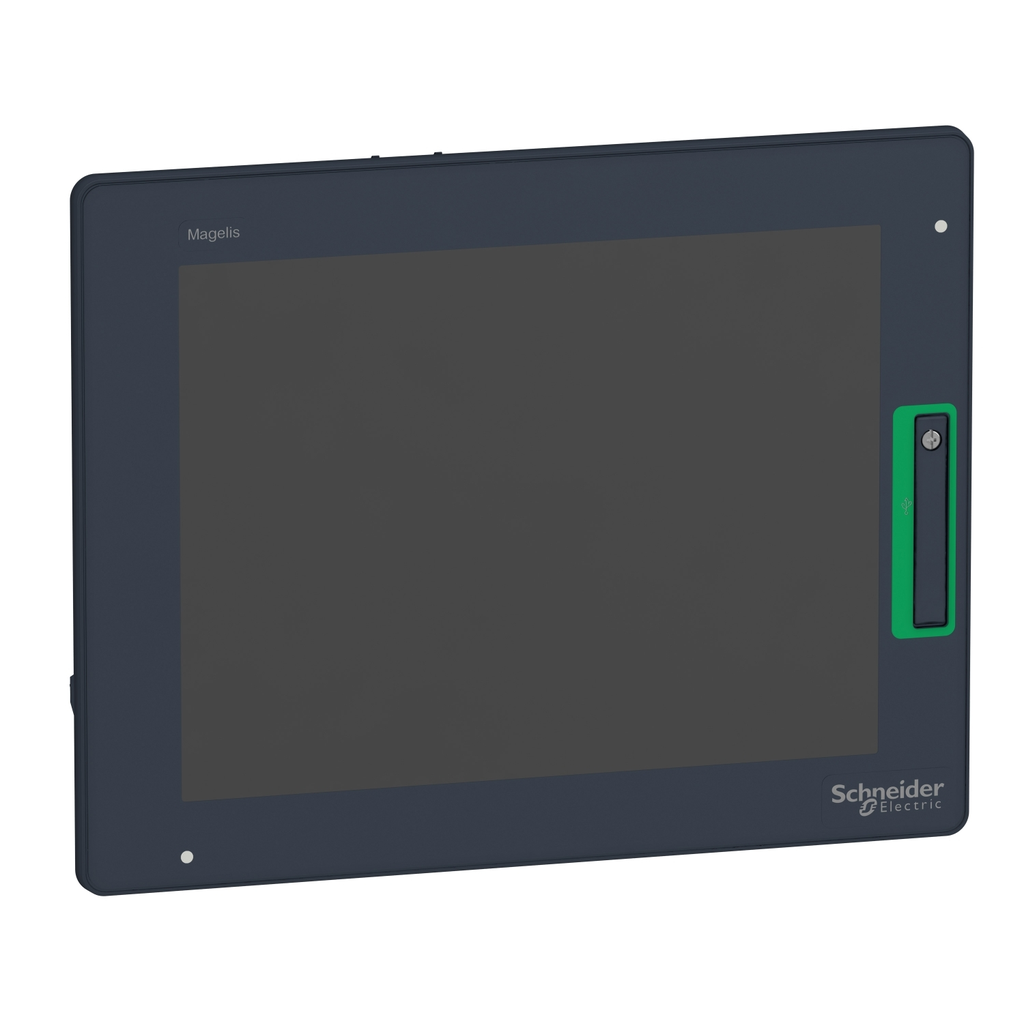
This HMI product belongs to Schneider Electric's Harmony GTU range. This flat touchscreen display is a multi touch analogue resistive panel. It comes with a coated 10.4" color TFT LCD display with 800 x 600 pixels (SVGA) resolution. The screen displays text messages and graphic objects and mimics diagrams, control, and configuration of data. It also offers removable storage, dual LAN and dual communication interfaces. This product works at a power consumption of 15 W and a rated voltage from 12V to 24V DC. Its dimensions are 272.5mm (width) x 214.5mm (height) x 67mm (depth) and weighs 2.7 kg. Its front panel comes with IP66 degree of protection. It is ideal for high-performance monitoring and communication thanks to a smartphone-like interface for use in the most demanding automation systems, including industrial control equipments, hazardous locations, and marine applications. It resists permanent 60°C temperature, this makes it ideal for installation in areas where ventilation of the cabinet is not possible or risky.