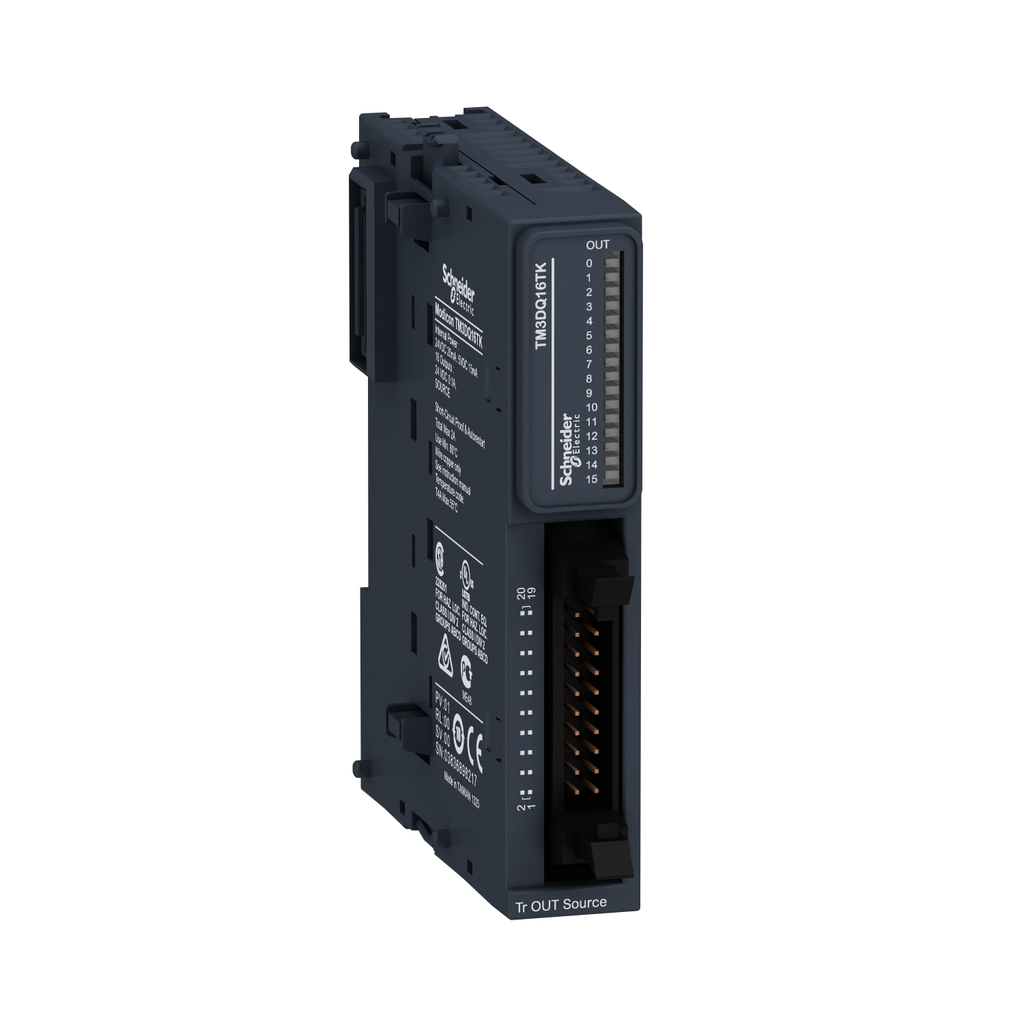
This product is part of the Modicon TM3 range, an offer of expansion I/O modules for Modicon M221, M241, M251 and M262. The discrete output module provides 16 transistor outputs with source (positive) logic. It is an output module with an output voltage of 24V DC and a current consumption of 20mA at 24V DC via bus connector. This product is capable of controlling variable speed drives or any device equipped with a current or voltage input. There is an insulation between output and supply at 1500V AC, output and internal logic at 500V AC. It is furnished with HE-10 connector outputs for electrical connection with pitch 3.81mm adjustment for outputs. It is an IP20 rated product. Its dimensions are 21.4mm (Width) x 81.3mm (Depth) x 90mm (Height). It weighs 0.72kg. This product is certified by CE, CULus and C-Tick. It meets EN/IEC 61131-2 and EN/IEC 61010-2-201 standards. This module is compatible with Modicon M241, Modicon M251 and Modicon M221 logic controller. It supports top hat type TH35-15, top hat type TH35-7.5 rail conforming to IEC 60715 and plate or panel with fixing kit mount. Modicon TM3 expansion modules have been designed with a simple interlocking assembly mechanism. A bus expansion connector is used to distribute data and the power supply when assembling the Modicon TM3 modules with logic controllers. Boost the performance of your controller with the Modicon TM3 I/O system specially designed for the Modicon M221, M241 and M251 logic controllers.