-
Country of Origin:
USA
-
Depth:
2.52 in
-
Warranty Length:
18 mth
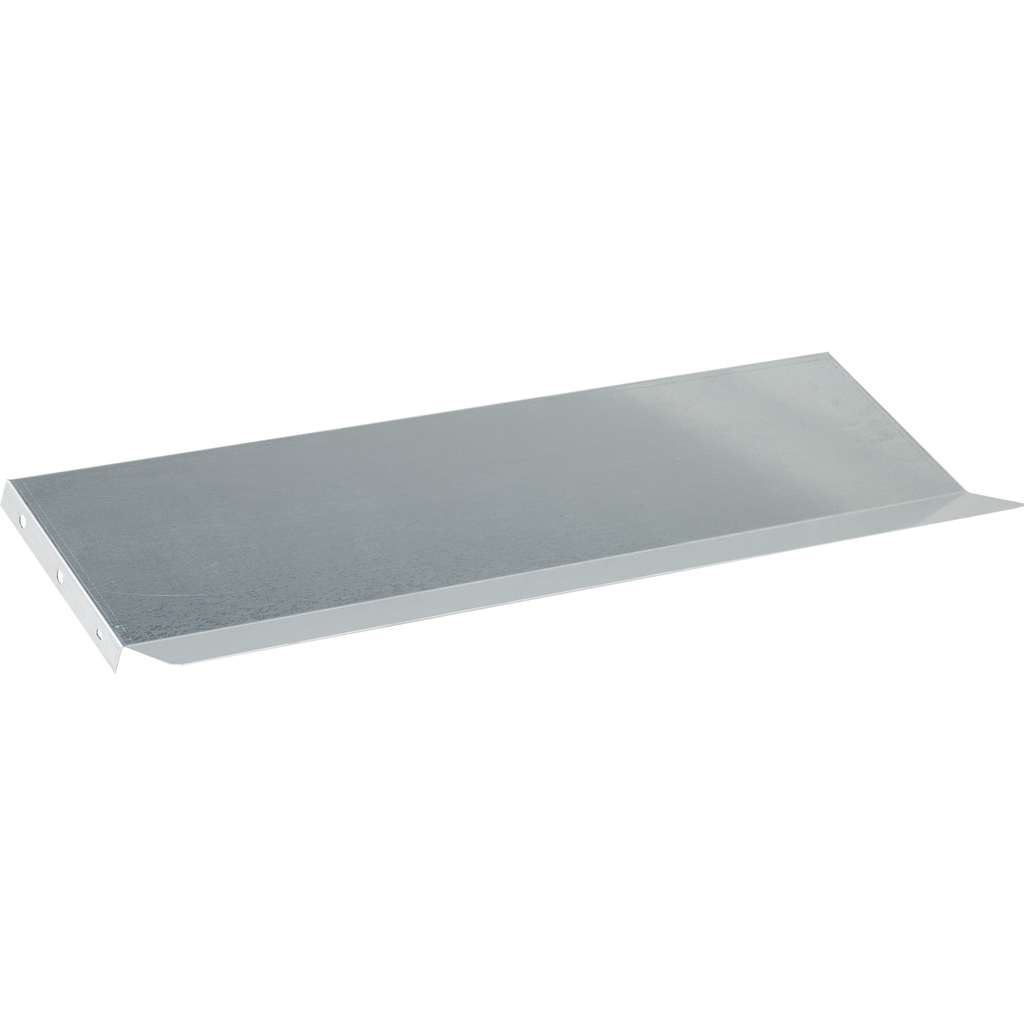
Square D™ I-Line Power Distribution Panelboards are ideal for service entrance equipment or downstream distribution panels in the electrical system. I-line power distribution panelboards are for use on AC or DC systems. The I-Line power distribution panelboard is the most versatile on the market and feature Schneider Electric's unique breaker engagement system which allows 15 A branch circuit breaker next to or across from a 1200 A circuit breaker. I-Line circuit breaker panelboards are available as 400–1200 A main lugs only and 100–1200 A main circuit breakers. This drip hood is used with HCM I-line distrubution panelboard and is surface mounted. This product is certified to cULus & CE standards. The panels, labeled cULus (compliance to UL and CSA standards certified by UL) are also Underwriters Laboratories (UL) Listed under File E33139.