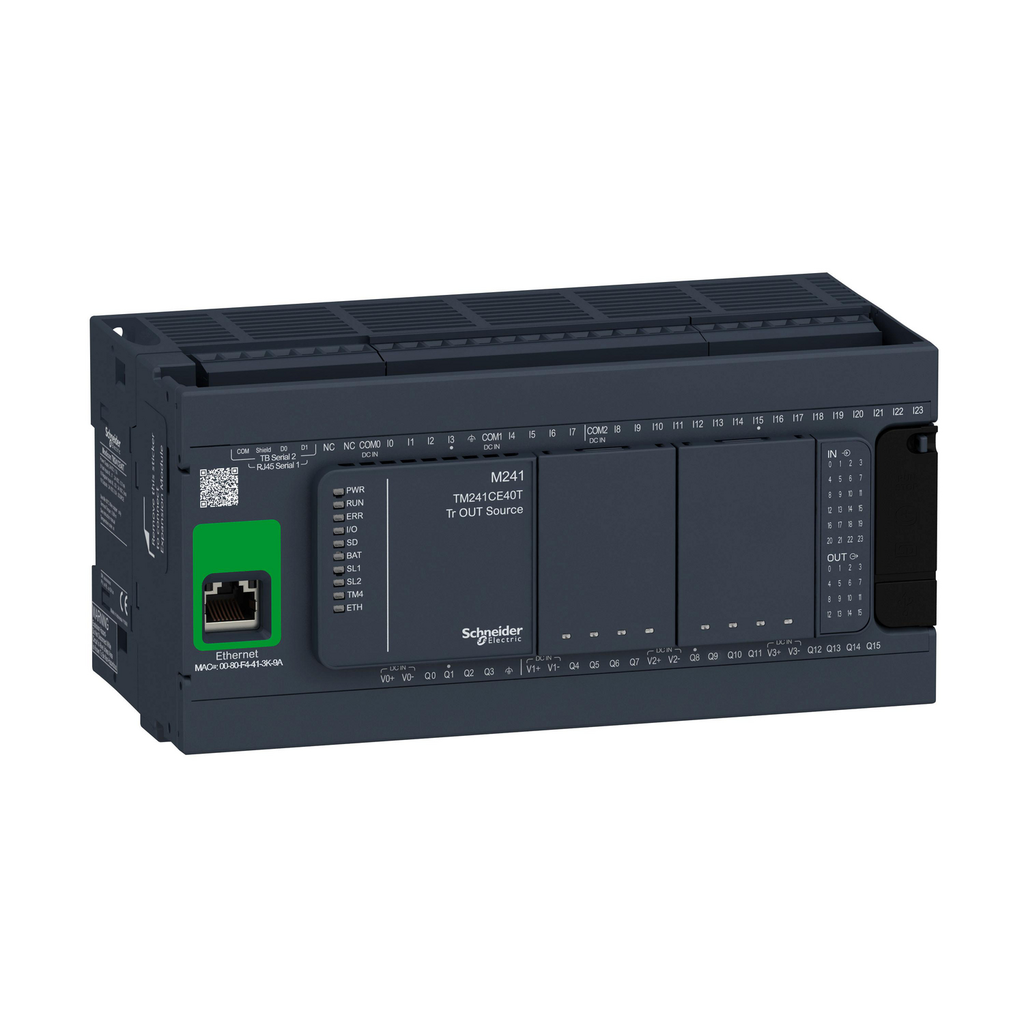
This product is part of the Modicon M241 range, an offer of logic controllers for performance demanding applications. This logic controller provides 24 discrete, 8 fast inputs, 16 transistor, 4 fast outputs with ethernet PNP transistor output. It is a Modicon logic controller with a rated supply/output voltage of 24V DC and an output current of 0.5A for transistor output, 0.1A for fast output current with sink or source input logic positive output logic. This product enables to build application intuitively as never before due to an organised screen design. Integrated connections are USB port with mini B USB 2.0, non isolated serial link 1 with RJ45 and RS232/RS485 interface, non isolated serial link 2 with removable screw terminal block and RS485 interface and ethernet with RJ45 . It is a Modicon M241 controller with 8MB for program, 64MB for system memory RAM, 128MB built-in flash memory for backup of user programs and a SD card memory capacity of 16GB. It is an IP20 rated product. Its dimensions are 190mm (Width) x 95mm (Depth) x 90mm (Height). It weighs 0.62kg. The Modicon M241 logic controllers are designed for high-performance compact machines incorporating speed and position control functions. This product is certified by CE, IACS E10, CSA, RCM and CULus. It meets ANSI/ISA 12-12-01, CSA C22.2 No 142, CSA C22.2 No 213, EN/IEC 61131-22007, marine specification (LR, ABS, DNV, GL), UL 1604 and UL 508 standards. It supports DIN rail mount. Achieve benchmark performance while increasing profitability with the Modicon M241 through intuitive machine programming with EcoStruxure Machine Expert, ready-to-use applications and function blocks.