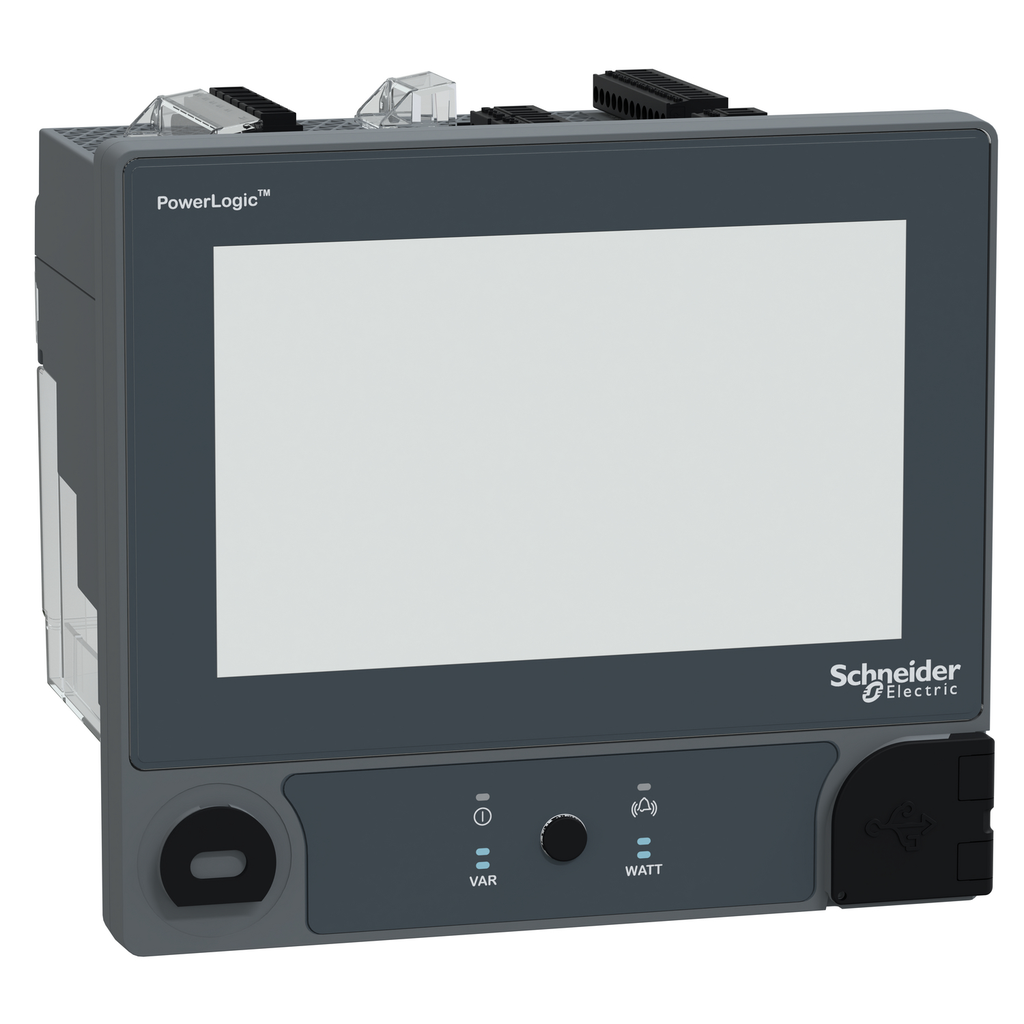
PowerLogic™ ION9000T meter, HSTC, DIN mount, 192 mm display, B2B adapter, HW kit

PowerLogic� ION9000T meter, HS

SQDMETSEION95040 METSEION95040 3606481352354
17264.21 / EA
http://schema.org/OutOfStock
  • Country of Origin: Canada
  • IsSustainable: Yes
The PowerLogic ION9000 is your 24/7 power quality expert, providing information, not just data. A comprehensive, industry-leading Power Quality Instrument (PQI-A) certified to IEC 62586-1/-2 ensures reliable, precision performance that is perfect for bot
QTY
  • Product Description
  • Features
  • Specifications
The PowerLogic ION9000 is your 24/7 power quality expert, providing information, not just data. A comprehensive, industry-leading Power Quality Instrument (PQI-A) certified to IEC 62586-1/-2 ensures reliable, precision performance that is perfect for bot
  • Data Recording
    • time stamping
    • min/max of instantaneous values
    • user-definable data logs
    • continuous logging or snapshot
    • trending/forecasting
    • event logs
    • alarm logs
    • configuration change
    • power outage
    • user login/logout
    • data logs
    • GPS synchronisation
    • seq
  • US Rated Supply Voltage
    • 90...480 V AC 45...66 Hz +/- 10 %
    • 90...120 V AC 400 Hz +/- 10 %
    • 90...120 V AC 400 Hz +/- 10
  • Mounting Support
    • DIN rail meter device
    • door cut-out remote display
  • Ethernet Service
    • DHCP client
    • Device Profile Web Services (DPWS)
    • Rapid Scanning Tree Protocol (RSTP)
    • FTP/HTTP/HTTPS
  • Analogue Input Type
    • voltage (impedance 5 MOhm)
    • external CT (impedance 0.3 mOhm)5 x
  • Ride Through Time
    • 100 ms 6 cycles at 60 Hz 120 V AC typical
    • 400 ms 24 cycles at 60 Hz 240 V AC typical
    • 4
  • IP Degree Of Protection
    • IP65 front:
    • IP30 rear:
  • Prop 65
    • WARNING: This product can expose you to chemicals including: Lead and lead compounds, which is known to the State of California to cause cancer and birth defects or other reproductive harm. For more information go to www.P65Warnings.ca.gov
  • Carbon Footprint Of The Installation Phase A5
    • 2.294506837578233
    • 2 kg CO2 eq.
  • Carbon Footprint Of The End Of Life Phase C1 To C4
    • 7 kg CO2 eq.
    • 7.028088781627571
  • Standards
    • ANSI C12.20
    • ANSI C37.90.1
    • IEC 61000-4-15
    • IEC 61000-4-30
    • IEC 61010-1
    • IEC 61326-1
    • IEC 61557-12
    • IEC 61850
    • IEC 62052-11
    • IEC 62052-31
    • IEC 62053-22
    • IEC 62053-23
    • IEC 62053-24
    • IEC 62586
    • UL 61010-1
  • Communication Port Support
    • 2 RS485 removable screw terminal block
  • Maximum Power Consumption In VA
    • 80 VA 480 V AC
  • Communication Modules
    • METSEPMFIBER
    • METSEPMRS4854W
  • Carbon Footprint Of The Manufacturing Phase A1 To A3
    • 264 kg CO2 eq.
    • 263.84260237756365
  • Power Quality Analysis
    • EN 50160 compliance checking
    • IEEE 519 harmonic limit
    • IEC 61000-4-30 class A compliance reporting
    • IEEE 519 compliance reporting
    • IEEE 519 compli
  • Electrical Insulation Class
    • class III EN/IEC 62052-11
  • Isolation Voltage
    • III400-690 V conforming to EN 61010-1:ed. 3
    • III347-600 V conforming to UL 61010-1:ed. 3
    • III347-600 V conforming to UL 6101
  • Communication Port Protocol
    • Modbus RTU 2400...115200 bps - 2-wire
    • ION 2400...115200 bps - 2-wire
    • DNP3 2400...115200 bps - 2-wire
    • DNP3 2400...115
  • Power Consumption In VA
    • 38 VA 480 V AC
  • Number Of Inputs
    • 8 digital 30 V AC/60 V DC
  • Quality Labels
    • ISO 9001
    • ISO 14000
  • Type Of Measurement
    • voltage sags and swells
    • current sags and swells
    • voltage
    • current
    • frequency
    • active and reactive power total
    • apparent power total
    • active and reactive power per phase
    • ap
  • Carbon Footprint Of The Use Phase B2 B3 B4 B6
    • 603 kg CO2 eq.
    • 602.9313330204241
  • Electromagnetic Compatibility
    • EMC immunity conforming to IEC 62052-11
    • EMC immunity conforming to IEC 61326-1
    • EMC immunity conforming to IEC 61000-6-5
    • electrostatic
  • Number Of Outputs
    • 4 digital
    • 2 form C relay output
  • Auxiliaries
    • METSEPM89M2600
    • METSEPM89M0024
  • Measurement Accuracy
    • voltage +/- 0.1 %
    • current +/- 0.1 %
  • Carbon Footprint Of The Distribution Phase A4
    • 2.160330208874166
    • 2 kg CO2 eq.
  • Port Ethernet
    • 10/100BASE-TX 2 RJ45
  • Measurement Voltage
    • 57-400 V AC 42...69 Hz between phase and neutral
    • 100-690 V AC 42...69 Hz between phases
    • 100-690 V AC 42...6
  • Time Synchronisation Protocol
    • GPS
    • IRIG-B
    • NTP
    • SNTP
    • PTP
  • Communications & Management Attributes
    • Communication Gateway : Ethernet/serial
  • Important Information Attributes
    • B2B Bullet Point 1 : Fast access to timely, critical information for energy, electrical network, and asset management
    • B2B Bullet Point 2 : Help operations personnel avoid downtime by making power quality understandable
    • B2B Bullet Point 3 : Makes energy and power quality actionable to support your op and sustainability goals
    • B2B Bullet Point 4 : More detailed PQ compliance reporting, and expert level power quality and root cause analytics
    • B2B Bullet Point 5 : High Speed Transient Capture unmasks hidden PQ phenomenon
    • B2B Bullet Point 6 : Ensure energy efficiency and optimized costs by understanding how energy is being consumed
    • B2B Bullet Point 7 : Perform sub billing or allocate cost to encourage energy efficient behavior, reduce PF penalties
    • B2B Bullet Point 8 : Support participation in demand response or variable tariff (TOU, RTP) programs
    • B2B Bullet Point 9 : Maximize use of capacity by performing load studies and infrastructure expansion planning
    • B2B Bullet Point 10 : Patented ION Programming allows for full alarm/calc customization, control and more
    • Local Data Status : Publishable
    • Local Publishable Date : 2025-09-08
    • HTML Description : PowerLogic ION9000T meter, HSTC, DIN mount, 192 mm display, B2B adapter, HW kit
    • Manufacturer : Schneider Electric
    • Device Type : Relay, Control & Measurement - measuring, monitoring device
    • Serviceability : Yes
    • Traceability : Yes
    • Field Service Division : DPIBS
    • Average Life Duration : 15 year(s)
    • Manufacturing Carbon Footprint : 263.842602377564
    • Distribution Carbon Footprint : 2.16033020887417
    • Installation Carbon Footprint : 2.29450683757823
    • Use Carbon Footprint : 602.931333020424
    • End Of Life Carbon Footprint : 7.02808878162757
    • Legacy WEEE Scope : In
    • WEEE Product Category : 5
    • Scope Perimeter : At least in Europe
    • EOLI Availability Display : Yes
    • End Of Life Doc Ref : ENVEOLI1801009_V2
    • Reach Full Compliance Status : Reference contains Substances of Very High Concern above the threshold
    • Reach Full Compliance Status Id : CONTAINS_SVHC
    • Reach Compliance Directive : Reference contains Substances of Very High Concern above the threshold
    • ROHS EUR In Scope : Yes
    • ROHS EUR Status : Compliant with Exemptions
    • ROHS EUR Conformity Date : 1840
    • ROHS EUR Full Compliance Status : Compliant with Exemptions
    • ROHS EUR Full Compliance Status Id : COMPLIANT_WITH_EXEMPTIONS
    • China ROHS In Scope : Yes
    • China ROHS Label : 7
    • Green Premium Status For Reporting : Green Premium product
    • With Recycled Cardboard : Yes
    • Without Single Use Plastic : No
    • Return Indicator : N
    • WD Status : 1 - GSC certified
    • Dangerous Goods Code : LITHIUM METAL BATTERIES IN EQUIP. BUTTON CELL-BAT EXEMPT
    • Device Short Name : ION95040
    • Frequency Measurement Range : 20-450 Hz
    • Package Weight Lbs : 3.631 kg
    • Product Availability : Stock - Normally stocked in distribution facility
    • Product Or Component Type : energy and power quality meter
    • Range : PowerLogic
    • Returnability : No
    • Sustainable Packaging : No
    • Tamperproof Of Settings : protected by sealable cover
    • Total Lifecycle Carbon Footprint : 878 kg CO2 eq.
    • Weee Label : The product must be disposed on European Union markets following specific waste collection and never end up in rubbish bins.
    • Carbon Footprint Kg Co2 Eq Total Life Cycle : 878.2568612260677
    • Relationship Type : Compatible relationship
    • Pep Code : ENVPEP1801009_V2
    • Pep Verification Date : 2025-05-20
    • PCR Version : PEP-PCR-ed4-2021 09 06
    • PSR Version : PSR-0005-ed3.1-EN-2023 12 08
    • Type Of Verification For The Pep : Independent external review
    • Product Weight In G : 3623
    • Functional Unit Description : The functional unit for the PowerLogic™ ION9000T meter (METSEION95040) is to provide accurate power quality monitoring and energy metering for a period of 10 years, ensuring compliance with international power quality standards and delivering high-resolu
    • Functional Unit Quantity : 1
    • Functional Unit Unit : unit
    • Reference Lifetime In Y : 10
    • Energy Consumption On Product Lifetime In Kwh : 1509.3480000000002
    • Energy Model Manufacturing A1 A3 : Electricity Mix; Low voltage; 2020; Canada, CA
    • Energy Model Installation A5 : No energy used
    • Energy Model Use B6 : Electricity Mix; Low voltage; 2020; United States, US
    • Energy Model End Of Life C1 C4 : Global
    • Recyclability Potential In : 6
    • Acidification Ap Mole Of H Equiv Total Life Cycle : 4.835567306659711
    • Acidification Ap Mole Of H Equiv Manufacturing A1 A3 : 1.7497563646053889
    • Acidification Ap Mole Of H Equiv Distribution A4 : 0.009399770084943524
    • Acidification Ap Mole Of H Equiv Installation A5 : 0.0006293991425719082
    • Acidification Ap Mole Of H Equiv Maintenance B2 : 0
    • Acidification Ap Mole Of H Equiv Repair B3 : 0
    • Acidification Ap Mole Of H Equiv Replacement B4 : 0
    • Acidification Ap Mole Of H Equiv Operational Energy Use B6 : 3.0697976604376387
    • Acidification Ap Mole Of H Equiv End Of Life C1 C4 : 0.005984112389167703
    • Acidification Ap Mole Of H Equiv Benefits Loads Beyond System Boundaries D : -0.016493997966812998
    • Biogenic Carbon Content Of The Associated Packaging Kg Of C Total Life Cycle : 0
    • Biogenic Carbon Content Of The Associated Packaging Kg Of C Manufacturing A1 A3 : 0
    • Biogenic Carbon Content Of The Associated Packaging Kg Of C Distribution A4 : 0
    • Biogenic Carbon Content Of The Associated Packaging Kg Of C Installation A5 : 0
    • Biogenic Carbon Content Of The Associated Packaging Kg Of C Maintenance B2 : 0
    • Biogenic Carbon Content Of The Associated Packaging Kg Of C Repair B3 : 0
    • Biogenic Carbon Content Of The Associated Packaging Kg Of C Replacement B4 : 0
    • Biogenic Carbon Content Of The Associated Packaging Kg Of C Operational Energy Use B6 : 0
    • Biogenic Carbon Content Of The Associated Packaging Kg Of C End Of Life C1 C4 : 0
    • Biogenic Carbon Content Of The Associated Packaging Kg Of C Benefits Loads Beyond System Boundaries D : 0
    • Biogenic Carbon Content Of The Product Kg Of C Total Life Cycle : 0
    • Biogenic Carbon Content Of The Product Kg Of C Manufacturing A1 A3 : 0
    • Biogenic Carbon Content Of The Product Kg Of C Distribution A4 : 0
    • Biogenic Carbon Content Of The Product Kg Of C Installation A5 : 0
    • Biogenic Carbon Content Of The Product Kg Of C Maintenance B2 : 0
    • Biogenic Carbon Content Of The Product Kg Of C Repair B3 : 0
    • Biogenic Carbon Content Of The Product Kg Of C Replacement B4 : 0
    • Biogenic Carbon Content Of The Product Kg Of C Operational Energy Use B6 : 0
    • Biogenic Carbon Content Of The Product Kg Of C End Of Life C1 C4 : 0
    • Biogenic Carbon Content Of The Product Kg Of C Benefits Loads Beyond System Boundaries D : 0
    • Climate Change Biogenics Kg Co2 Eq Total Life Cycle : 10.145604023417297
    • Climate Change Biogenics Kg Co2 Eq Manufacturing A1 A3 : 0.15061963944839613
    • Climate Change Biogenics Kg Co2 Eq Distribution A4 : 0
    • Climate Change Biogenics Kg Co2 Eq Installation A5 : 0.33575928364976837
    • Climate Change Biogenics Kg Co2 Eq Maintenance B2 : 0
    • Climate Change Biogenics Kg Co2 Eq Repair B3 : 0
    • Climate Change Biogenics Kg Co2 Eq Replacement B4 : 0
    • Climate Change Biogenics Kg Co2 Eq Operational Energy Use B6 : 9.651287842511028
    • Climate Change Biogenics Kg Co2 Eq End Of Life C1 C4 : 0.007937257808103082
    • Climate Change Biogenics Kg Co2 Eq Benefits Loads Beyond System Boundaries D : -0.053308881337383325
    • Climate Change Fossil Fuels Kg Co2 Eq Total Life Cycle : 868.1093946862946
    • Climate Change Fossil Fuels Kg Co2 Eq Manufacturing A1 A3 : 263.6901203535386
    • Climate Change Fossil Fuels Kg Co2 Eq Distribution A4 : 2.160330208874166
    • Climate Change Fossil Fuels Kg Co2 Eq Installation A5 : 1.958747553928465
    • Climate Change Fossil Fuels Kg Co2 Eq Maintenance B2 : 0
    • Climate Change Fossil Fuels Kg Co2 Eq Repair B3 : 0
    • Climate Change Fossil Fuels Kg Co2 Eq Replacement B4 : 0
    • Climate Change Fossil Fuels Kg Co2 Eq Operational Energy Use B6 : 593.2800451779132
    • Climate Change Fossil Fuels Kg Co2 Eq End Of Life C1 C4 : 7.020151392040216
    • Climate Change Fossil Fuels Kg Co2 Eq Benefits Loads Beyond System Boundaries D : -1.6081511306900131
    • Climate Change Total Kg Co2 Eq Total Life Cycle : 878.2568612260677
    • Climate Change Total Kg Co2 Eq Manufacturing A1 A3 : 263.84260237756365
    • Climate Change Total Kg Co2 Eq Distribution A4 : 2.160330208874166
    • Climate Change Total Kg Co2 Eq Installation A5 : 2.294506837578233
    • Climate Change Total Kg Co2 Eq Maintenance B2 : 0
    • Climate Change Total Kg Co2 Eq Repair B3 : 0
    • Climate Change Total Kg Co2 Eq Replacement B4 : 0
    • Climate Change Total Kg Co2 Eq Operational Energy Use B6 : 602.9313330204241
    • Climate Change Total Kg Co2 Eq End Of Life C1 C4 : 7.028088781627571
    • Climate Change Total Kg Co2 Eq Benefits Loads Beyond System Boundaries D : -1.6614600120273977
    • Components For Re Use Kg Total Life Cycle : 0
    • Components For Re Use Kg Manufacturing A1 A3 : 0
    • Components For Re Use Kg Distribution A4 : 0
    • Components For Re Use Kg Installation A5 : 0
    • Components For Re Use Kg Maintenance B2 : 0
    • Components For Re Use Kg Repair B3 : 0
    • Components For Re Use Kg Replacement B4 : 0
    • Components For Re Use Kg Operational Energy Use B6 : 0
    • Components For Re Use Kg End Of Life C1 C4 : 0
    • Components For Re Use Kg Benefits Loads Beyond System Boundaries D : 0
    • Depletion Of Abiotic Resources Elements Kg Equivalent Sb Total Life Cycle : 0.028800973973364813
    • Depletion Of Abiotic Resources Elements Kg Equivalent Sb Manufacturing A1 A3 : 0.028639016092263016
    • Depletion Of Abiotic Resources Elements Kg Equivalent Sb Distribution A4 : 0.00000000018593698067
    • Depletion Of Abiotic Resources Elements Kg Equivalent Sb Installation A5 : 0.00000000268998621958
    • Depletion Of Abiotic Resources Elements Kg Equivalent Sb Maintenance B2 : 0
    • Depletion Of Abiotic Resources Elements Kg Equivalent Sb Repair B3 : 0
    • Depletion Of Abiotic Resources Elements Kg Equivalent Sb Replacement B4 : 0
    • Depletion Of Abiotic Resources Elements Kg Equivalent Sb Operational Energy Use B6 : 0.00015386566545871674
    • Depletion Of Abiotic Resources Elements Kg Equivalent Sb End Of Life C1 C4 : 0.0000080893397198811
    • Depletion Of Abiotic Resources Elements Kg Equivalent Sb Benefits Loads Beyond System Boundaries D : -0.00007015708493907659
    • Depletion Of Abiotic Resources Fossil Fuels Mj Total Life Cycle : 16089.580895646212
    • Depletion Of Abiotic Resources Fossil Fuels Mj Manufacturing A1 A3 : 3285.2593525216275
    • Depletion Of Abiotic Resources Fossil Fuels Mj Distribution A4 : 26.914787159191263
    • Depletion Of Abiotic Resources Fossil Fuels Mj Installation A5 : 0.8202397469004004
    • Depletion Of Abiotic Resources Fossil Fuels Mj Maintenance B2 : 0
    • Depletion Of Abiotic Resources Fossil Fuels Mj Repair B3 : 0
    • Depletion Of Abiotic Resources Fossil Fuels Mj Replacement B4 : 0
    • Depletion Of Abiotic Resources Fossil Fuels Mj Operational Energy Use B6 : 12762.763205567955
    • Depletion Of Abiotic Resources Fossil Fuels Mj End Of Life C1 C4 : 13.823310650537389
    • Depletion Of Abiotic Resources Fossil Fuels Mj Benefits Loads Beyond System Boundaries D : -23.206629021985986
    • Ecotoxicity Fresh Water Ctue Total Life Cycle : 2267.280123901971
    • Ecotoxicity Fresh Water Ctue Manufacturing A1 A3 : 1192.067820411937
    • Ecotoxicity Fresh Water Ctue Distribution A4 : 17.622890942216248
    • Ecotoxicity Fresh Water Ctue Installation A5 : 33.352750722684625
    • Ecotoxicity Fresh Water Ctue Maintenance B2 : 0
    • Ecotoxicity Fresh Water Ctue Repair B3 : 0
    • Ecotoxicity Fresh Water Ctue Replacement B4 : 0
    • Ecotoxicity Fresh Water Ctue Operational Energy Use B6 : 891.0816035127974
    • Ecotoxicity Fresh Water Ctue End Of Life C1 C4 : 133.15505831233577
    • Ecotoxicity Fresh Water Ctue Benefits Loads Beyond System Boundaries D : -8.608665671022433
    • Emission Of Fine Particles Incidence Of Diseases Total Life Cycle : 0.00003135649701000913
    • Emission Of Fine Particles Incidence Of Diseases Manufacturing A1 A3 : 0.00000958642978948573
    • Emission Of Fine Particles Incidence Of Diseases Distribution A4 : 0.00000002551388539602
    • Emission Of Fine Particles Incidence Of Diseases Installation A5 : 0.00000000328332923042
    • Emission Of Fine Particles Incidence Of Diseases Maintenance B2 : 0
    • Emission Of Fine Particles Incidence Of Diseases Repair B3 : 0
    • Emission Of Fine Particles Incidence Of Diseases Replacement B4 : 0
    • Emission Of Fine Particles Incidence Of Diseases Operational Energy Use B6 : 0.00002170191153233477
    • Emission Of Fine Particles Incidence Of Diseases End Of Life C1 C4 : 0.0000000393584735622
    • Emission Of Fine Particles Incidence Of Diseases Benefits Loads Beyond System Boundaries D : -0.00000014964934249832
    • Exported Energy Mj By Energy Vector Total Life Cycle : 0.002547517960967493
    • Exported Energy Mj By Energy Vector Manufacturing A1 A3 : 0.0009202201171659215
    • Exported Energy Mj By Energy Vector Distribution A4 : 0
    • Exported Energy Mj By Energy Vector Installation A5 : 0
    • Exported Energy Mj By Energy Vector Maintenance B2 : 0
    • Exported Energy Mj By Energy Vector Repair B3 : 0
    • Exported Energy Mj By Energy Vector Replacement B4 : 0
    • Exported Energy Mj By Energy Vector Operational Energy Use B6 : 0
    • Exported Energy Mj By Energy Vector End Of Life C1 C4 : 0.0016272978438015718
    • Exported Energy Mj By Energy Vector Benefits Loads Beyond System Boundaries D : 0
    • Freshwater Eutrophication Kg P Eq Total Life Cycle : 0.0018534077065955868
    • Freshwater Eutrophication Kg P Eq Manufacturing A1 A3 : 0.0006012303123928282
    • Freshwater Eutrophication Kg P Eq Distribution A4 : 0.00000025328961324141
    • Freshwater Eutrophication Kg P Eq Installation A5 : 0.00001615697531249288
    • Freshwater Eutrophication Kg P Eq Maintenance B2 : 0
    • Freshwater Eutrophication Kg P Eq Repair B3 : 0
    • Freshwater Eutrophication Kg P Eq Replacement B4 : 0
    • Freshwater Eutrophication Kg P Eq Operational Energy Use B6 : 0.0009528593307681398
    • Freshwater Eutrophication Kg P Eq End Of Life C1 C4 : 0.0002829077985088845
    • Freshwater Eutrophication Kg P Eq Benefits Loads Beyond System Boundaries D : -0.00000595168557243405
    • Hazardous Waste Disposed Of Kg Total Life Cycle : 449.2249041495268
    • Hazardous Waste Disposed Of Kg Manufacturing A1 A3 : 447.69366887255535
    • Hazardous Waste Disposed Of Kg Distribution A4 : 0.0017921599098019343
    • Hazardous Waste Disposed Of Kg Installation A5 : 0.0002299190961957651
    • Hazardous Waste Disposed Of Kg Maintenance B2 : 0
    • Hazardous Waste Disposed Of Kg Repair B3 : 0
    • Hazardous Waste Disposed Of Kg Replacement B4 : 0
    • Hazardous Waste Disposed Of Kg Operational Energy Use B6 : 0
    • Hazardous Waste Disposed Of Kg End Of Life C1 C4 : 1.529213197965478
    • Hazardous Waste Disposed Of Kg Benefits Loads Beyond System Boundaries D : -6.308163777704104
    • Human Toxicity Carcinogenic Effects Ctuh Total Life Cycle : 0.00000139681186772867
    • Human Toxicity Carcinogenic Effects Ctuh Manufacturing A1 A3 : 0.00000012108159881435
    • Human Toxicity Carcinogenic Effects Ctuh Distribution A4 : 0.00000000003051968204
    • Human Toxicity Carcinogenic Effects Ctuh Installation A5 : 0.0000000016236604844
    • Human Toxicity Carcinogenic Effects Ctuh Maintenance B2 : 0
    • Human Toxicity Carcinogenic Effects Ctuh Repair B3 : 0
    • Human Toxicity Carcinogenic Effects Ctuh Replacement B4 : 0
    • Human Toxicity Carcinogenic Effects Ctuh Operational Energy Use B6 : 0.00000007166631665419
    • Human Toxicity Carcinogenic Effects Ctuh End Of Life C1 C4 : 0.0000012024097720937
    • Human Toxicity Carcinogenic Effects Ctuh Benefits Loads Beyond System Boundaries D : -0.00000020844896181885
    • Human Toxicity Non Carcinogenic Effects Ctuh Total Life Cycle : 0.00000648917267305288
    • Human Toxicity Non Carcinogenic Effects Ctuh Manufacturing A1 A3 : 0.0000044699164503613
    • Human Toxicity Non Carcinogenic Effects Ctuh Distribution A4 : 0.00000000462873462458
    • Human Toxicity Non Carcinogenic Effects Ctuh Installation A5 : 0.0000000024733019387
    • Human Toxicity Non Carcinogenic Effects Ctuh Maintenance B2 : 0
    • Human Toxicity Non Carcinogenic Effects Ctuh Repair B3 : 0
    • Human Toxicity Non Carcinogenic Effects Ctuh Replacement B4 : 0
    • Human Toxicity Non Carcinogenic Effects Ctuh Operational Energy Use B6 : 0.00000184215081773699
    • Human Toxicity Non Carcinogenic Effects Ctuh End Of Life C1 C4 : 0.00000017000336839131
    • Human Toxicity Non Carcinogenic Effects Ctuh Benefits Loads Beyond System Boundaries D : -0.00000009472340144027
    • Impacts Related To Land Use Soil Quality Total Life Cycle : 20.736103219095426
    • Impacts Related To Land Use Soil Quality Manufacturing A1 A3 : 5.676337751980474
    • Impacts Related To Land Use Soil Quality Distribution A4 : 0
    • Impacts Related To Land Use Soil Quality Installation A5 : 0
    • Impacts Related To Land Use Soil Quality Maintenance B2 : 0
    • Impacts Related To Land Use Soil Quality Repair B3 : 0
    • Impacts Related To Land Use Soil Quality Replacement B4 : 0
    • Impacts Related To Land Use Soil Quality Operational Energy Use B6 : 14.309445965349575
    • Impacts Related To Land Use Soil Quality End Of Life C1 C4 : 0.7503195017653805
    • Impacts Related To Land Use Soil Quality Benefits Loads Beyond System Boundaries D : 0
    • Ionizing Radiation Human Health Kbq Of U235 Equiv Total Life Cycle : 608.7274177760787
    • Ionizing Radiation Human Health Kbq Of U235 Equiv Manufacturing A1 A3 : 87.59836973391697
    • Ionizing Radiation Human Health Kbq Of U235 Equiv Distribution A4 : 0.004795882445371044
    • Ionizing Radiation Human Health Kbq Of U235 Equiv Installation A5 : 0.00253089512799764
    • Ionizing Radiation Human Health Kbq Of U235 Equiv Maintenance B2 : 0
    • Ionizing Radiation Human Health Kbq Of U235 Equiv Repair B3 : 0
    • Ionizing Radiation Human Health Kbq Of U235 Equiv Replacement B4 : 0
    • Ionizing Radiation Human Health Kbq Of U235 Equiv Operational Energy Use B6 : 521.1045834876596
    • Ionizing Radiation Human Health Kbq Of U235 Equiv End Of Life C1 C4 : 0.01713777692871927
    • Ionizing Radiation Human Health Kbq Of U235 Equiv Benefits Loads Beyond System Boundaries D : -11.266044701049601
    • Marine Aquatic Eutrophication Kg Of N Equiv Total Life Cycle : 0.5600185872380291
    • Marine Aquatic Eutrophication Kg Of N Equiv Manufacturing A1 A3 : 0.18744257138499856
    • Marine Aquatic Eutrophication Kg Of N Equiv Distribution A4 : 0.004319575956709583
    • Marine Aquatic Eutrophication Kg Of N Equiv Installation A5 : 0.00023330708092694254
    • Marine Aquatic Eutrophication Kg Of N Equiv Maintenance B2 : 0
    • Marine Aquatic Eutrophication Kg Of N Equiv Repair B3 : 0
    • Marine Aquatic Eutrophication Kg Of N Equiv Replacement B4 : 0
    • Marine Aquatic Eutrophication Kg Of N Equiv Operational Energy Use B6 : 0.365524574078845
    • Marine Aquatic Eutrophication Kg Of N Equiv End Of Life C1 C4 : 0.0024985587365489973
    • Marine Aquatic Eutrophication Kg Of N Equiv Benefits Loads Beyond System Boundaries D : -0.0009505895594049345
    • Materials For Energy Recovery Kg Total Life Cycle : 0.00000002143661311605
    • Materials For Energy Recovery Kg Manufacturing A1 A3 : 0.00000002143661311605
    • Materials For Energy Recovery Kg Distribution A4 : 0
    • Materials For Energy Recovery Kg Installation A5 : 0
    • Materials For Energy Recovery Kg Maintenance B2 : 0
    • Materials For Energy Recovery Kg Repair B3 : 0
    • Materials For Energy Recovery Kg Replacement B4 : 0
    • Materials For Energy Recovery Kg Operational Energy Use B6 : 0
    • Materials For Energy Recovery Kg End Of Life C1 C4 : 0
    • Materials For Energy Recovery Kg Benefits Loads Beyond System Boundaries D : 0
    • Materials For Recycling Kg Total Life Cycle : 0.25089165524347723
    • Materials For Recycling Kg Manufacturing A1 A3 : 0.08638128433280357
    • Materials For Recycling Kg Distribution A4 : 0
    • Materials For Recycling Kg Installation A5 : 0
    • Materials For Recycling Kg Maintenance B2 : 0
    • Materials For Recycling Kg Repair B3 : 0
    • Materials For Recycling Kg Replacement B4 : 0
    • Materials For Recycling Kg Operational Energy Use B6 : 0
    • Materials For Recycling Kg End Of Life C1 C4 : 0.1645103709106737
    • Materials For Recycling Kg Benefits Loads Beyond System Boundaries D : 0
    • Net Use Of Fresh Water M3 Total Life Cycle : 2.4833263915321275
    • Net Use Of Fresh Water M3 Manufacturing A1 A3 : 1.581934242205272
    • Net Use Of Fresh Water M3 Distribution A4 : 0.0025551594568246844
    • Net Use Of Fresh Water M3 Installation A5 : 0.004298945746489409
    • Net Use Of Fresh Water M3 Maintenance B2 : 0
    • Net Use Of Fresh Water M3 Repair B3 : 0
    • Net Use Of Fresh Water M3 Replacement B4 : 0
    • Net Use Of Fresh Water M3 Operational Energy Use B6 : 0.8836646900663157
    • Net Use Of Fresh Water M3 End Of Life C1 C4 : 0.010873354057225643
    • Net Use Of Fresh Water M3 Benefits Loads Beyond System Boundaries D : -0.01445054057298294
    • Non Hazardous Waste Disposed Of Kg Total Life Cycle : 174.46554179908546
    • Non Hazardous Waste Disposed Of Kg Manufacturing A1 A3 : 72.85813638274352
    • Non Hazardous Waste Disposed Of Kg Distribution A4 : 0.0022016456021259167
    • Non Hazardous Waste Disposed Of Kg Installation A5 : 1.3243437727615543
    • Non Hazardous Waste Disposed Of Kg Maintenance B2 : 0
    • Non Hazardous Waste Disposed Of Kg Repair B3 : 0
    • Non Hazardous Waste Disposed Of Kg Replacement B4 : 0
    • Non Hazardous Waste Disposed Of Kg Operational Energy Use B6 : 99.4272244723248
    • Non Hazardous Waste Disposed Of Kg End Of Life C1 C4 : 0.8536355256534465
    • Non Hazardous Waste Disposed Of Kg Benefits Loads Beyond System Boundaries D : -2.6448082665012618
    • Ozone Depletion Kg Equivalent Cfc 11 Total Life Cycle : 0.00003939068277033003
    • Ozone Depletion Kg Equivalent Cfc 11 Manufacturing A1 A3 : 0.00003500671088960226
    • Ozone Depletion Kg Equivalent Cfc 11 Distribution A4 : 0.00000190886849709413
    • Ozone Depletion Kg Equivalent Cfc 11 Installation A5 : 0.00000000286827076489
    • Ozone Depletion Kg Equivalent Cfc 11 Maintenance B2 : 0
    • Ozone Depletion Kg Equivalent Cfc 11 Repair B3 : 0
    • Ozone Depletion Kg Equivalent Cfc 11 Replacement B4 : 0
    • Ozone Depletion Kg Equivalent Cfc 11 Operational Energy Use B6 : 0.00000245930317303643
    • Ozone Depletion Kg Equivalent Cfc 11 End Of Life C1 C4 : 0.00000001293193983232
    • Ozone Depletion Kg Equivalent Cfc 11 Benefits Loads Beyond System Boundaries D : -0.00000023789090977042
    • Photochemical Ozone Formation Kg Of Nmvoc Equiv Total Life Cycle : 1.8650867040574568
    • Photochemical Ozone Formation Kg Of Nmvoc Equiv Manufacturing A1 A3 : 0.6684353231793632
    • Photochemical Ozone Formation Kg Of Nmvoc Equiv Distribution A4 : 0.015347581490229889
    • Photochemical Ozone Formation Kg Of Nmvoc Equiv Installation A5 : 0.000591052451457876
    • Photochemical Ozone Formation Kg Of Nmvoc Equiv Maintenance B2 : 0
    • Photochemical Ozone Formation Kg Of Nmvoc Equiv Repair B3 : 0
    • Photochemical Ozone Formation Kg Of Nmvoc Equiv Replacement B4 : 0
    • Photochemical Ozone Formation Kg Of Nmvoc Equiv Operational Energy Use B6 : 1.1743278294260506
    • Photochemical Ozone Formation Kg Of Nmvoc Equiv End Of Life C1 C4 : 0.006384917510355085
    • Photochemical Ozone Formation Kg Of Nmvoc Equiv Benefits Loads Beyond System Boundaries D : -0.0038392705178418155
    • Radioactive Waste Disposed Of Kg Total Life Cycle : 0.06168518221857339
    • Radioactive Waste Disposed Of Kg Manufacturing A1 A3 : 0.040249724837453385
    • Radioactive Waste Disposed Of Kg Distribution A4 : 0.0004300690953273959
    • Radioactive Waste Disposed Of Kg Installation A5 : 0.00002464812537673755
    • Radioactive Waste Disposed Of Kg Maintenance B2 : 0
    • Radioactive Waste Disposed Of Kg Repair B3 : 0
    • Radioactive Waste Disposed Of Kg Replacement B4 : 0
    • Radioactive Waste Disposed Of Kg Operational Energy Use B6 : 0.020938072644072356
    • Radioactive Waste Disposed Of Kg End Of Life C1 C4 : 0.00004266751634350515
    • Radioactive Waste Disposed Of Kg Benefits Loads Beyond System Boundaries D : -0.0020885870867432556
    • Terrestrial Eutrophication Mole Of N Equiv Total Life Cycle : 7.488049068249884
    • Terrestrial Eutrophication Mole Of N Equiv Manufacturing A1 A3 : 1.9921625172770905
    • Terrestrial Eutrophication Mole Of N Equiv Distribution A4 : 0.046807026559199674
    • Terrestrial Eutrophication Mole Of N Equiv Installation A5 : 0.002805545548222694
    • Terrestrial Eutrophication Mole Of N Equiv Maintenance B2 : 0
    • Terrestrial Eutrophication Mole Of N Equiv Repair B3 : 0
    • Terrestrial Eutrophication Mole Of N Equiv Replacement B4 : 0
    • Terrestrial Eutrophication Mole Of N Equiv Operational Energy Use B6 : 5.420189574748553
    • Terrestrial Eutrophication Mole Of N Equiv End Of Life C1 C4 : 0.026084404116818265
    • Terrestrial Eutrophication Mole Of N Equiv Benefits Loads Beyond System Boundaries D : -0.010515438605950226
    • Total Use Of Non Renewable Primary Energy Resources Primary Energy And Primary Energy Resources Used As Raw Materials Mj Total Life Cycle : 65.94543689945188
    • Total Use Of Non Renewable Primary Energy Resources Primary Energy And Primary Energy Resources Used As Raw Materials Mj Manufacturing A1 A3 : 65.94543689945188
    • Total Use Of Non Renewable Primary Energy Resources Primary Energy And Primary Energy Resources Used As Raw Materials Mj Distribution A4 : 0
    • Total Use Of Non Renewable Primary Energy Resources Primary Energy And Primary Energy Resources Used As Raw Materials Mj Installation A5 : 0
    • Total Use Of Non Renewable Primary Energy Resources Primary Energy And Primary Energy Resources Used As Raw Materials Mj Maintenance B2 : 0
    • Total Use Of Non Renewable Primary Energy Resources Primary Energy And Primary Energy Resources Used As Raw Materials Mj Repair B3 : 0
    • Total Use Of Non Renewable Primary Energy Resources Primary Energy And Primary Energy Resources Used As Raw Materials Mj Replacement B4 : 0
    • Total Use Of Non Renewable Primary Energy Resources Primary Energy And Primary Energy Resources Used As Raw Materials Mj Operational Energy Use B6 : 0
    • Total Use Of Non Renewable Primary Energy Resources Primary Energy And Primary Energy Resources Used As Raw Materials Mj End Of Life C1 C4 : 0
    • Total Use Of Non Renewable Primary Energy Resources Primary Energy And Primary Energy Resources Used As Raw Materials Mj Benefits Loads Beyond System Boundaries D : 0
    • Total Use Of Primary Energy During The Life Cycle Mj Total Life Cycle : 19461.33424824743
    • Total Use Of Primary Energy During The Life Cycle Mj Manufacturing A1 A3 : 3410.5809538373182
    • Total Use Of Primary Energy During The Life Cycle Mj Distribution A4 : 26.914963123702737
    • Total Use Of Primary Energy During The Life Cycle Mj Installation A5 : 0.8314521386402192
    • Total Use Of Primary Energy During The Life Cycle Mj Maintenance B2 : 0
    • Total Use Of Primary Energy During The Life Cycle Mj Repair B3 : 0
    • Total Use Of Primary Energy During The Life Cycle Mj Replacement B4 : 0
    • Total Use Of Primary Energy During The Life Cycle Mj Operational Energy Use B6 : 16008.967938275711
    • Total Use Of Primary Energy During The Life Cycle Mj End Of Life C1 C4 : 14.038940872054257
    • Total Use Of Primary Energy During The Life Cycle Mj Benefits Loads Beyond System Boundaries D : -24.356043332304406
    • Total Use Of Renewable Primary Energy Resources Primary Energy And Primary Energy Resources Used As Raw Materials Mj Total Life Cycle : 3371.753352601229
    • Total Use Of Renewable Primary Energy Resources Primary Energy And Primary Energy Resources Used As Raw Materials Mj Manufacturing A1 A3 : 125.32160131569093
    • Total Use Of Renewable Primary Energy Resources Primary Energy And Primary Energy Resources Used As Raw Materials Mj Distribution A4 : 0.00017596451147753516
    • Total Use Of Renewable Primary Energy Resources Primary Energy And Primary Energy Resources Used As Raw Materials Mj Installation A5 : 0.011212391739818695
    • Total Use Of Renewable Primary Energy Resources Primary Energy And Primary Energy Resources Used As Raw Materials Mj Maintenance B2 : 0
    • Total Use Of Renewable Primary Energy Resources Primary Energy And Primary Energy Resources Used As Raw Materials Mj Repair B3 : 0
    • Total Use Of Renewable Primary Energy Resources Primary Energy And Primary Energy Resources Used As Raw Materials Mj Replacement B4 : 0
    • Total Use Of Renewable Primary Energy Resources Primary Energy And Primary Energy Resources Used As Raw Materials Mj Operational Energy Use B6 : 3246.20473270777
    • Total Use Of Renewable Primary Energy Resources Primary Energy And Primary Energy Resources Used As Raw Materials Mj End Of Life C1 C4 : 0.2156302215168679
    • Total Use Of Renewable Primary Energy Resources Primary Energy And Primary Energy Resources Used As Raw Materials Mj Benefits Loads Beyond System Boundaries D : -1.1494143103184218
    • Use Of Non Renewable Primary Energy Resources Used As Raw Materials Mj Total Life Cycle : 65.94543689945188
    • Use Of Non Renewable Primary Energy Resources Used As Raw Materials Mj Manufacturing A1 A3 : 65.94543689945188
    • Use Of Non Renewable Primary Energy Resources Used As Raw Materials Mj Distribution A4 : 0
    • Use Of Non Renewable Primary Energy Resources Used As Raw Materials Mj Installation A5 : 0
    • Use Of Non Renewable Primary Energy Resources Used As Raw Materials Mj Maintenance B2 : 0
    • Use Of Non Renewable Primary Energy Resources Used As Raw Materials Mj Repair B3 : 0
    • Use Of Non Renewable Primary Energy Resources Used As Raw Materials Mj Replacement B4 : 0
    • Use Of Non Renewable Primary Energy Resources Used As Raw Materials Mj Operational Energy Use B6 : 0
    • Use Of Non Renewable Primary Energy Resources Used As Raw Materials Mj End Of Life C1 C4 : 0
    • Use Of Non Renewable Primary Energy Resources Used As Raw Materials Mj Benefits Loads Beyond System Boundaries D : 0
    • Use Of Non Renewable Primary Energy Excluding Non Renewable Primary Energy Resources Used As Raw Materials Mj Total Life Cycle : 16023.63545874676
    • Use Of Non Renewable Primary Energy Excluding Non Renewable Primary Energy Resources Used As Raw Materials Mj Manufacturing A1 A3 : 3219.313915622175
    • Use Of Non Renewable Primary Energy Excluding Non Renewable Primary Energy Resources Used As Raw Materials Mj Distribution A4 : 26.914787159191263
    • Use Of Non Renewable Primary Energy Excluding Non Renewable Primary Energy Resources Used As Raw Materials Mj Installation A5 : 0.8202397469004004
    • Use Of Non Renewable Primary Energy Excluding Non Renewable Primary Energy Resources Used As Raw Materials Mj Maintenance B2 : 0
    • Use Of Non Renewable Primary Energy Excluding Non Renewable Primary Energy Resources Used As Raw Materials Mj Repair B3 : 0
    • Use Of Non Renewable Primary Energy Excluding Non Renewable Primary Energy Resources Used As Raw Materials Mj Replacement B4 : 0
    • Use Of Non Renewable Primary Energy Excluding Non Renewable Primary Energy Resources Used As Raw Materials Mj Operational Energy Use B6 : 12762.763205567955
    • Use Of Non Renewable Primary Energy Excluding Non Renewable Primary Energy Resources Used As Raw Materials Mj End Of Life C1 C4 : 13.823310650537389
    • Use Of Non Renewable Primary Energy Excluding Non Renewable Primary Energy Resources Used As Raw Materials Mj Benefits Loads Beyond System Boundaries D : -23.206629021985986
    • Use Of Non Renewable Secondary Fuels Mj Total Life Cycle : 0
    • Use Of Non Renewable Secondary Fuels Mj Manufacturing A1 A3 : 0
    • Use Of Non Renewable Secondary Fuels Mj Distribution A4 : 0
    • Use Of Non Renewable Secondary Fuels Mj Installation A5 : 0
    • Use Of Non Renewable Secondary Fuels Mj Maintenance B2 : 0
    • Use Of Non Renewable Secondary Fuels Mj Repair B3 : 0
    • Use Of Non Renewable Secondary Fuels Mj Replacement B4 : 0
    • Use Of Non Renewable Secondary Fuels Mj Operational Energy Use B6 : 0
    • Use Of Non Renewable Secondary Fuels Mj End Of Life C1 C4 : 0
    • Use Of Non Renewable Secondary Fuels Mj Benefits Loads Beyond System Boundaries D : 0
    • Use Of Renewable Primary Energy Resources Used As Raw Materials Mj Total Life Cycle : 5.26898915342693
    • Use Of Renewable Primary Energy Resources Used As Raw Materials Mj Manufacturing A1 A3 : 5.26898915342693
    • Use Of Renewable Primary Energy Resources Used As Raw Materials Mj Distribution A4 : 0
    • Use Of Renewable Primary Energy Resources Used As Raw Materials Mj Installation A5 : 0
    • Use Of Renewable Primary Energy Resources Used As Raw Materials Mj Maintenance B2 : 0
    • Use Of Renewable Primary Energy Resources Used As Raw Materials Mj Repair B3 : 0
    • Use Of Renewable Primary Energy Resources Used As Raw Materials Mj Replacement B4 : 0
    • Use Of Renewable Primary Energy Resources Used As Raw Materials Mj Operational Energy Use B6 : 0
    • Use Of Renewable Primary Energy Resources Used As Raw Materials Mj End Of Life C1 C4 : 0
    • Use Of Renewable Primary Energy Resources Used As Raw Materials Mj Benefits Loads Beyond System Boundaries D : 0
    • Use Of Renewable Primary Energy Excluding Renewable Primary Energy Resources Used As Raw Materials Mj Total Life Cycle : 3366.484363447802
    • Use Of Renewable Primary Energy Excluding Renewable Primary Energy Resources Used As Raw Materials Mj Manufacturing A1 A3 : 120.05261216226401
    • Use Of Renewable Primary Energy Excluding Renewable Primary Energy Resources Used As Raw Materials Mj Distribution A4 : 0.00017596451147753516
    • Use Of Renewable Primary Energy Excluding Renewable Primary Energy Resources Used As Raw Materials Mj Installation A5 : 0.011212391739818695
    • Use Of Renewable Primary Energy Excluding Renewable Primary Energy Resources Used As Raw Materials Mj Maintenance B2 : 0
    • Use Of Renewable Primary Energy Excluding Renewable Primary Energy Resources Used As Raw Materials Mj Repair B3 : 0
    • Use Of Renewable Primary Energy Excluding Renewable Primary Energy Resources Used As Raw Materials Mj Replacement B4 : 0
    • Use Of Renewable Primary Energy Excluding Renewable Primary Energy Resources Used As Raw Materials Mj Operational Energy Use B6 : 3246.20473270777
    • Use Of Renewable Primary Energy Excluding Renewable Primary Energy Resources Used As Raw Materials Mj End Of Life C1 C4 : 0.2156302215168679
    • Use Of Renewable Primary Energy Excluding Renewable Primary Energy Resources Used As Raw Materials Mj Benefits Loads Beyond System Boundaries D : -1.1494143103184218
    • Use Of Renewable Secondary Fuels Mj Total Life Cycle : 0
    • Use Of Renewable Secondary Fuels Mj Manufacturing A1 A3 : 0
    • Use Of Renewable Secondary Fuels Mj Distribution A4 : 0
    • Use Of Renewable Secondary Fuels Mj Installation A5 : 0
    • Use Of Renewable Secondary Fuels Mj Maintenance B2 : 0
    • Use Of Renewable Secondary Fuels Mj Repair B3 : 0
    • Use Of Renewable Secondary Fuels Mj Replacement B4 : 0
    • Use Of Renewable Secondary Fuels Mj Operational Energy Use B6 : 0
    • Use Of Renewable Secondary Fuels Mj End Of Life C1 C4 : 0
    • Use Of Renewable Secondary Fuels Mj Benefits Loads Beyond System Boundaries D : 0
    • Use Of Secondary Materials Kg Total Life Cycle : 0.000422795407299698
    • Use Of Secondary Materials Kg Manufacturing A1 A3 : 0.000422795407299698
    • Use Of Secondary Materials Kg Distribution A4 : 0
    • Use Of Secondary Materials Kg Installation A5 : 0
    • Use Of Secondary Materials Kg Maintenance B2 : 0
    • Use Of Secondary Materials Kg Repair B3 : 0
    • Use Of Secondary Materials Kg Replacement B4 : 0
    • Use Of Secondary Materials Kg Operational Energy Use B6 : 0
    • Use Of Secondary Materials Kg End Of Life C1 C4 : 0
    • Use Of Secondary Materials Kg Benefits Loads Beyond System Boundaries D : 0
    • Water Use M3 Eq Total Life Cycle : 106.53625606867558
    • Water Use M3 Eq Manufacturing A1 A3 : 67.94405005637473
    • Water Use M3 Eq Distribution A4 : 0.10974409867062022
    • Water Use M3 Eq Installation A5 : 0.18463971981172012
    • Water Use M3 Eq Maintenance B2 : 0
    • Water Use M3 Eq Repair B3 : 0
    • Water Use M3 Eq Replacement B4 : 0
    • Water Use M3 Eq Operational Energy Use B6 : 37.83081385813773
    • Water Use M3 Eq End Of Life C1 C4 : 0.46700833568078615
    • Water Use M3 Eq Benefits Loads Beyond System Boundaries D : -0.6206484046424169
    • Air Pollution M3 Total Life Cycle : 0
    • Air Pollution M3 Manufacturing A1 A3 : 0
    • Air Pollution M3 Distribution A4 : 0
    • Air Pollution M3 Installation A5 : 0
    • Air Pollution M3 Maintenance B2 : 0
    • Air Pollution M3 Repair B3 : 0
    • Air Pollution M3 Replacement B4 : 0
    • Air Pollution M3 Operational Energy Use B6 : 0
    • Air Pollution M3 End Of Life C1 C4 : 0
    • Air Pollution M3 Benefits Loads Beyond System Boundaries D : 0
    • Water Pollution M3 Total Life Cycle : 0
    • Water Pollution M3 Manufacturing A1 A3 : 0
    • Water Pollution M3 Distribution A4 : 0
    • Water Pollution M3 Installation A5 : 0
    • Water Pollution M3 Maintenance B2 : 0
    • Water Pollution M3 Repair B3 : 0
    • Water Pollution M3 Replacement B4 : 0
    • Water Pollution M3 Operational Energy Use B6 : 0
    • Water Pollution M3 End Of Life C1 C4 : 0
    • Water Pollution M3 Benefits Loads Beyond System Boundaries D : 0
  • General Attributes
    • Product Or Component Type : energy and power quality meter
  • Environment Attributes
    • ROHS Exemption Information : Yes
    • China ROHS url : https://checkaproduct.se.com/DistantRequestDispatcher.aspx?action=exportPdfRoHSChina&pid=475354658&lang=en-us
    • Take Back : No
    • China ROHS Regulation : X
    • Mercury Free : Yes
    • Carbon Footprint : 878.256861226068
    • Ambient Air Temperature For Operation : -25-70 °C
    • Circularity Profile : ENVEOLI1801009_V2
    • Environmental Disclosure : ENVPEP1801009_V2
    • EU ROHS Directive : Compliant with Exemptions
    • Packaging Made With Recycled Cardboard : Yes
    • Packaging Without Single Use Plastic : No
    • Reach Regulation : Reference contains Substances of Very High Concern above the threshold
    • Relative Humidity : 5-95 %
    • Pep Code : ENVPEP1801009_V2
    • Pep Verification Date : 2025-05-20
    • PCR Version : PEP-PCR-ed4-2021 09 06
    • PSR Version : PSR-0005-ed3.1-EN-2023 12 08
    • Type Of Verification For The Pep : Independent external review
  • Specifications
    • Country of Origin : Canada